
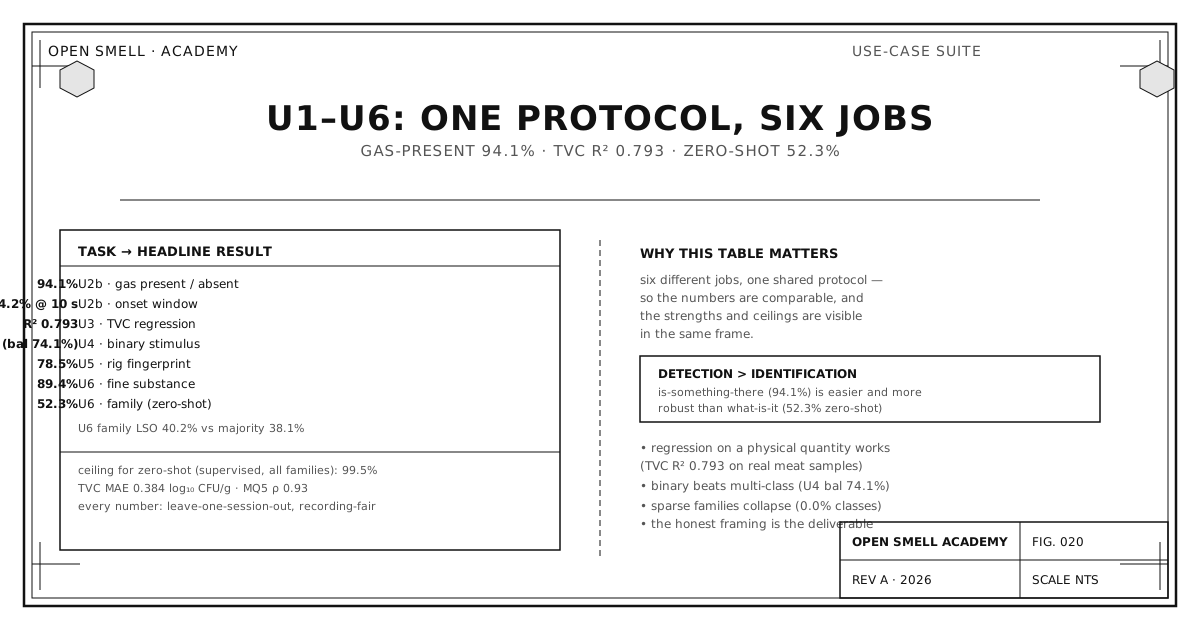
Can a low-cost metal-oxide array, driving the OpenSmell framework's feature extractor, do real jobs — gas alarms, spoilage checks, indoor-air events, device identity — and can we measure the answer without fooling ourselves? The U-suite (U1–U6) is that measurement: six evaluations of the framework on public e-nose datasets, run through one shared harness, scored under a recording-fair protocol, with null baselines printed in the same table as every headline.
One framing note before the numbers. This suite runs on a fixed protocol: one shared harness, recording-fair grouping, every headline printed beside its null baseline, and committed result artifacts with generated_utc provenance. Some numbers are seed-averaged (U5's k-shot curve averages five seeds); because the suite is built to be re-run end-to-end, every claim is checkable against the committed artifacts. Anyone can re-run it and verify that the claims hold.
1. Protocol
Every experiment used the same pipeline — dataset loader → windowing + framework feature extraction → evaluation → report — and every one obeyed the same three rules:
- Recording-fair grouping. Windows from the same physical recording never cross the train/test boundary (GroupKFold / LeaveOneGroupOut / leave-one-out over the natural grouping: recording, cut, induction, or substance). The group key is an explicit, versioned argument to the evaluator.
- Baselines in the table. Chance accuracy and the majority predictor (or the mean predictor, for regression) sit beside every headline. A number that beats its baseline is a result; one that does not is printed anyway.
- Public data only, research/validation-only. No product training data, and the UCI corpora are research-only even where their badge reads CC BY 4.0.
Those rules are what make the numbers comparable to each other and to the field.
2. Datasets
| Dataset | Source | Sensors | License |
|---|---|---|---|
| Gas sensor array exposed to turbulent gas mixtures | UCI id 309 · Fonollosa et al. 2014 | 8 Figaro TGS | research-only |
| Gas sensor array under dynamic gas mixtures | UCI id 322 · Fonollosa et al. 2015 | 16 Figaro TGS | research-only |
| Gas sensor array drift | UCI id 146 | 16 MOX, 6 gases, 10 batches / 36 months | research-only |
| Gas sensors for home activity monitoring | UCI id 362 · Huerta et al. 2016 | 8 Figaro TGS + temp/humidity | research-only |
| Electronic nose from various beef cuts | Harvard Dataverse 10.7910/DVN/XNFVTS | 11 MQ, 12 cuts | CC0 1.0 |
| SmellNet | arXiv:2506.00239 · HF DeweiFeng/smell-net | 6 MOX, 50 substances | research |
All provenance, conversion formulas, and sha256s are committed in data/DATASETS.md inside the code repo.
3. U2 — Gas leaks and mixtures (UCI wind-tunnel data)
Detecting gas in air is the easiest job an e-nose has, and the numbers reflect it:
- Binary gas-present detection: 94.1% / 94.4% balanced (chance 50%, majority 65.5%), 5,220 windows over 180 recordings.
- Onset detection: 180/180 recordings detected, median latency 10 s; the onset window itself was classified correctly at 84.2% / 85.2% balanced.
- Mixture identity (ethylene-only / CO-only / methane-only / both): 89.2% / 83.9% balanced (chance 25%, majority 60.0%); secondary gas id (CO vs methane) 94.9%.
- Dynamic concentration tracking: on a continuous two-gas run, per-gas regression hit R² 0.922 (ethylene, MAE 0.62 ppm) and R² 0.952 (methane, MAE 5.7 ppm) — against a mean-predictor baseline of R² 0. Event/state classification reached 98.1% / 97.7% balanced (any-gas) and 96.7% / 96.6% balanced (four-state).
The read: detection and onset are reliable under realistic conditions. A MOX array using the framework tells you something is there within about ten seconds. That is the value proposition of a gas alarm.
The calibration caveat, measured. The suite also tested power-law concentration recovery on the turbulent data. Per-channel log-log R² is weak — median R² 0.276 for ethylene, 0.320 for CO, 0.067 for methane — and leave-one-out recovery lands within one decade on 94–100% of predictions (median log₁₀ error 0.16–0.30 decades). In words: the sensor responds to concentration, and recovery is a usable detection reference bounded by that ±0.16–0.30 decades error — the stated precision of this family of results.
4. U3 — Food spoilage (Harvard Dataverse beef cuts)
Electronic-nose readings from 12 beef cuts with hourly microbial ground truth — total viable counts (TVC) in log₁₀ CFU/g plus a 4-class freshness grade. Evaluation was leave-one-cut-out (12 groups); 876 windows, TVC range 1.88–5.76 log₁₀ CFU/g.
- TVC regression: R² 0.793, MAE 0.384 log₁₀ CFU/g (the mean predictor's MAE is 0.935 — a 59% improvement), RMSE 0.495, Spearman ρ 0.849.
- Four-class freshness: 78.4% / 64.5% balanced (chance 25%, majority 60.3%). Per class: 1→81.1%, 2→66.7%, 3→17.3%, 4→93.0%.
- Binary "spoiled" (TVC ≥ 5): 85.0% / 84.8% balanced (chance 50%, majority 60.3%).
- Strongest single-channel signals against TVC: MQ5 (ρ = 0.93), MQ4 (ρ = −0.90), MQ137 (ρ = 0.83).
Two scope notes. Class 3 — the transitional freshness bin — is a real weak spot (17.3%), which is exactly what the chemistry predicts: the middle of a spoilage curve is where the sensor signal stops changing monotonically. And the binary "spoiled/not-spoiled" question is the practically useful one — a consumer does not need "freshness class 2," they need "is this meat safe" — and that works at 85%.
5. U4 — Indoor-air monitoring (UCI-362 home activity)
Eight Figaro sensors in a real home, 99 gas inductions of background/wine/banana activity, ~929k rows. Temperature and humidity were excluded so the claim stays MOX-only; 3,960 windows, leave-one-induction-out.
- Binary stimulus detection: 87.6% / 74.1% balanced (chance 50%, majority 81.7%); background detected at 95.4%, stimulus at 52.8%.
- Three-class (background/wine/banana): 86.0% / 55.0% balanced (chance 33.3%, majority 81.7%). Banana: 4.5%.
The balanced accuracy carries the detail: the model beats the majority baseline but struggles on the stimulus class, and banana detection is at chance. "Detecting an event" works; "detecting which event, in a home, with a MOX array" is hard. Both numbers are printed because both are true.
6. U5 — Rig chemoprinting (UCI gas drift benchmark)
Six gases, 16 sensors, 10 batches over 36 months of real drift. Batches model rig / device-time states; fingerprinting uses batches 6/7/9/10 (all six gases, ≥20 samples each).
- Rig fingerprinting: pooled 78.5% (chance 25%), evaluated leave-gas-out — trained on five gases, identifying the rig on the sixth, so the rig pattern must generalize to a never-seen gas to count. Per gas: Acetaldehyde 91.5%, Ammonia 79.4%, Toluene 79.1%, Ethanol 78.1%, Acetone 77.7%, Ethylene 68.8%.
- Per-rig calibration curve: source batches 1–5 (3,633 measurements) → target batches 6–10 (10,277). Zero-shot transfer 52.3% (chance 16.7%, majority 20.0%); in-target supervised ceiling 99.5% (balanced 99.4%).
- The k-shot curve (labeled target samples added to the source training set, 5 seeds): k=5 → 65.6% ± 1.5, k=10 → 73.4% ± 2.3, k=25 → 83.5% ± 0.9, k=50 → 91.2% ± 0.4.
This is the suite's central result. A rig is identifiable from sensor statistics alone (78.5%) — the foundation for per-rig reference calibration, and the demonstration that every rig is subtly different. The 99.5% ceiling versus 52.3% zero-shot is the measured price of drift. The k-shot curve shows the fix: a handful of reference samples on the target rig recovers most of the gap. That curve is the empirical case for reference-point calibration in one chart.
Scope note. The drift batches are one physical array aging over time, so they model rig identity and device-time shift, not distinct manufactured hardware. Results describe these batches / this array, not a guarantee for other hardware.
7. U6 — Smell taxonomy (SmellNet + OSMO families)
SmellNet's 50 food substances (250 recordings, 4,903 windows), labeled with eight perceptual grand families from the OSMO taxonomy.
- Fine substance identity: 89.4% / 89.5% balanced (chance 2.0%, majority 2.3%), stratified group-6-fold over 250 recordings. Recognizing which of 50 foods works.
- Perceptual family (leave-one-substance-out, 50 groups): 40.2% vs majority 38.1% (chance 12.5%). Per class: Woody 65.2%, Green 41.7%, Fruity 28.5%, Herbal 21.7%; Citrus/Floral/Mineral/Soulful 0.0%.
- Fine→coarse collapse: 35.7% — predicting families from fine predictions does not recover family structure.
The read: identity is learned, family is not. The sensor distinguishes the 50 foods well, but the perceptual categories ("woody," "floral") do not fall out of raw sensor identity — the model can tell cumin from pineapple but cannot generalize to "this is a woody thing." The tiny families score 0.0% because one or two substances per family is too little data to learn a category from. This is the substance-generalization wall, measured at the perceptual level.
8. Synthesis table
| Evaluation | Headline | Balanced / chance | Majority |
|---|---|---|---|
| U2a mixture identity | 89.2% | 83.9% / 25% | 60.0% |
| U2b gas-present | 94.1% | 94.4% / 50% | 65.5% |
| U2b onset window | 84.2% | 85.2% / 50% | 60.0% |
| U2c any-gas (best) | 98.1% | 97.7% / 50% | 67.2% |
| U2c dynamic ppm | R² 0.922–0.952 | ρ 0.886–0.949 | mean-pred R² 0 |
| U3 TVC regression | R² 0.793 | ρ 0.849 | mean-pred MAE 0.935 |
| U3 4-class freshness | 78.4% | 64.5% / 25% | 60.3% |
| U4 binary stimulus | 87.6% | 74.1% / 50% | 81.7% |
| U5 rig fingerprint | 78.5% | — / 25% | — |
| U5 zero-shot | 52.3% | — / 16.7% | 20.0% |
| U5 in-target ceiling | 99.5% | — / 16.7% | 20.0% |
| U6 fine substance | 89.4% | 89.5% / 2.0% | 2.3% |
| U6 family (LSO) | 40.2% | — / 12.5% | 38.1% |
9. What this proves — and does not
Proves (recording-fair, public data, baselines in the same table): a single MOX device using the framework separates gases, detects onsets within ~10 seconds, tracks concentration, scores beef spoilage against microbial ground truth, and identifies 50 food substances at ~89% — all on held-out recordings. Rig identity is learnable from sensor statistics, which is the foundation for per-rig calibration.
Does not prove: zero-shot cross-device transfer (52.3% vs the 99.5% ceiling says no, reference-free), novel-substance generalization (the family result — 40.2% ≈ majority 38.1% — says no), or certified absolute quantification (power-law recovery is a detection reference at ±0.16–0.30 decades median).
The suite's real deliverable is the shape of that table: detection beats identification, quantification works against real ground truth, and every wall it hits is the same wall — the need for per-rig reference calibration.
10. Reproducibility
The entire suite is a standalone repository, opensmell/e-nose-evals: the shared harness/ (loaders, feature extraction, grouped evaluation, report emitter), all six uN_*/run_*.py entrypoints, and the committed results/*_metrics.json + *_analysis.md artifacts with generated_utc provenance — plus the dataset registry (data/DATASETS.md) and the bundled small datasets (drift batches, SmellNet offline recordings, OSMO taxonomy, beef-cut sheets) so U3/U5/U6 run out of the box. The three large UCI corpora are re-downloadable and never committed.
pip install -r requirements.txt
python selftest.py                     # U1 — no dataset needed
python u5_chemoprint/run_experiment.py # U5 — bundled drift data
If you re-run an experiment and your numbers differ, that is a finding — report it. The suite is designed so the comparison is possible.
11. Limitations
- Procedure-defined splits, not a frozen benchmark. No leaderboard exists; a formal benchmark (frozen splits, submission harness) is a separate, future project. Do not read this suite as one.
- One array, one time series per domain. U2–U4 each rest on a single device's recordings; U5 models device-time shift rather than manufactured hardware variation.
- Research-only data. The UCI corpora are restricted to non-commercial research; anything built on these numbers inherits that restriction.
- Feature-level, not raw, for U5. The drift dataset ships pre-extracted features, so the chemoprint experiments consume them directly rather than through the windowing pipeline.
12. References
- Fonollosa et al. 2014 — chemical discrimination in turbulent gas mixtures with MOX arrays (UCI 309).
- Fonollosa et al. 2015 — gas sensor arrays for real-time identification of dynamic gas mixtures (UCI 322).
- Vergara et al. 2012 — drift compensation for gas sensor arrays (UCI 146).
- Huerta et al. 2016 — gas sensors for home activity monitoring (UCI 362).
- Wijaya et al. — electronic nose from various beef cuts, Harvard Dataverse 10.7910/DVN/XNFVTS.
- Feng, D., Dai, W., Li, C., Pernigo, A., Wen, Y. & Liang, P. P. "SmellNet: A Large-scale Dataset for Real-world Smell Recognition." arXiv:2506.00239 (2025); ICLR 2026; dataset
DeweiFeng/smell-net. - Osmo Labs, PBC. "The Osmo Scent Taxonomy," v1.1, 2025 (ODC-ODbL): https://github.com/osmoai/taxonomy.
- Code and results:
opensmell/e-nose-evals; SmellNet code and ScentFormer: https://github.com/MIT-MI/SmellNet.